/ TECHNICAL LEADERSHIP
Where the work waits
A team can be busy all week and still struggle to finish anything. Follow the waiting before adding more work.
Try the model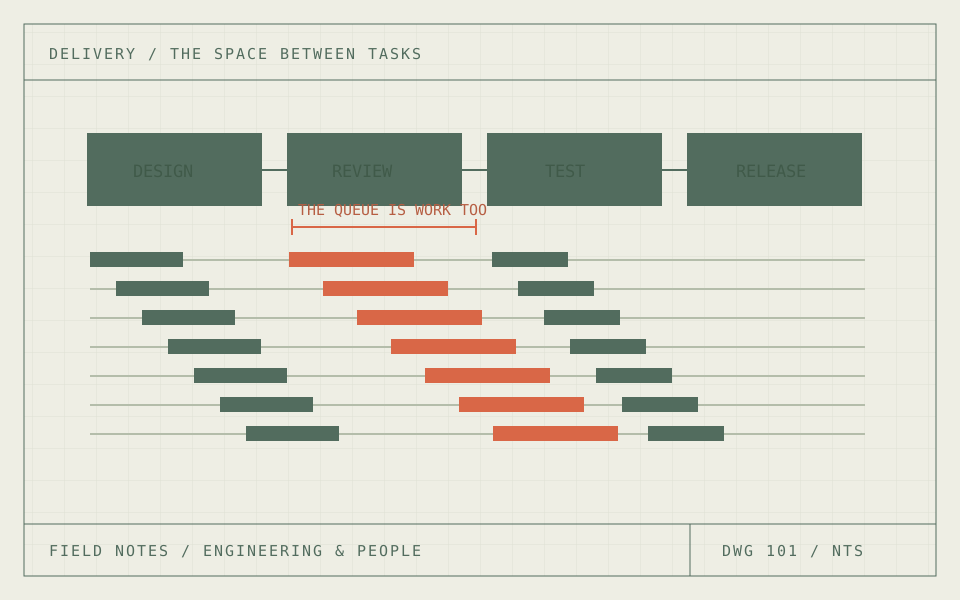
01 / FOLLOW THE WORK
Everyone is working. Why is nothing finished?
Picture a small engineering team with a full board. Design is moving. Review is backed up. Testing keeps starting and stopping. Every person can point to something useful they did today, but the delivery date keeps moving.
The easy response is to ask everyone to go faster. Sometimes a task really does need more help. But a project spends time between tasks too: waiting for a decision, an environment, a reviewer, or someone who knows which version is current. Those gaps rarely appear in a progress update.
Before changing the team, I want to see the route the work actually takes. When did the request arrive? When did anyone start it? When did it become ready for the next person? When did the next person pick it up? A handful of timestamps can make the conversation much more useful.
02 / FOLLOW THE WORK
Draw the queue, not just the tasks.
The example here sends twelve requests through design, review, test and release. One request arrives each working day. Design takes two days, review four, testing three and release one. Each handoff adds a day. There are two design slots, one review slot, two test slots and one release slot. These are invented numbers, chosen so the constraint is visible.
Two designers can produce about one design a day under these assumptions. One reviewer taking four days per item can handle only a quarter of an item a day. A queue is the predictable result. Making design twice as fast would give that reviewer a larger pile to work through.
A Gantt chart becomes more useful when it shows the empty space as well as the colored bars. The pale connectors in this drawing include queue time and the explicit handoff delay. That is where a discussion about delivery should start.
03 / FOLLOW THE WORK
Less work in flight is a choice about where to wait.
A limit on work in progress controls how many requests enter the active workflow. Lower it in the model and the active work becomes easier to follow. Look carefully at the intake queue, though. Requests outside the limit are still waiting. They have not disappeared just because the team has not started them.
The model reports both arrival-to-delivery lead time and admission-to-delivery cycle time. Improving the second while ignoring the first can make a dashboard look better without helping the person who made the request. A limit that is too low can also leave downstream capacity idle.
Little’s law connects average work in a system, its throughput and time in that system. The boundary and time window must be consistent. It is an accounting relationship under its applicable conditions, not a promise that cutting a WIP limit will automatically raise throughput. This finite twelve-item example has startup and shutdown effects, so I do not use its totals as a steady-state proof.
Average work in system = throughput × average time in system
04 / FOLLOW THE WORK
Change one constraint and watch where it moves.
Try adding a review slot. Then try shortening review time. Those changes address the constrained stage in this example, but they mean different things in a real team. A second reviewer needs the right context and authority. Shorter reviews might come from smaller changes, clearer acceptance criteria or a prepared test result. Simply asking for less scrutiny would be a different experiment.
Now remove some handoff delay. That could represent an agreed owner, an available test environment or a decision that no longer needs a weekly meeting. Notice which metric changes. Faster completion, less waiting inside the process and less waiting at intake are related, but they are not interchangeable.
Once review improves, testing can become the next constraint. That is a useful result. The team has changed the system enough for a different limitation to matter. Keep measuring instead of turning the first fix into a permanent slogan.
05 / FOLLOW THE WORK
The leadership work is in the handoff.
I would start with a recent set of completed requests and reconstruct their timelines. Then I would ask the people doing the work what caused the longest waits. A queue might reflect scarce expertise. It might also reflect an unclear decision, incomplete input or several teams protecting different priorities.
Choose one change, name an owner and agree on what improvement would count. Track delivery time from the original request, throughput over a useful window, rework and the age of unfinished requests. A quicker process that pushes defects into the next stage has not solved the whole problem.
The simulator leaves out interruptions, variable task sizes, absences, rework and priority changes. Real work includes all of those. Use the drawing to form a better question, then use the actual workflow to answer it. The point is to make a team’s effort turn into finished work more reliably.
THE EXPERIMENT / CHANGE ONE THING
Find the next useful change.
Change review capacity, review duration, WIP and handoff delay. Compare the full request time with time inside the active process.
SYNTHETIC EXAMPLE / LIVE RESULTS
Average queue waits: design 0.0, review 13.3, test 0.0, release 0.0 days. The explicit handoff delays are additional.
Read the request timelines
| Request | Arrived | Admitted | Delivered |
|---|---|---|---|
| 1 | 0 | 0 | 13 |
| 2 | 1 | 1 | 17 |
| 3 | 2 | 2 | 21 |
| 4 | 3 | 3 | 25 |
| 5 | 4 | 4 | 29 |
| 6 | 5 | 5 | 33 |
| 7 | 6 | 6 | 37 |
| 8 | 7 | 7 | 41 |
| 9 | 8 | 13 | 45 |
| 10 | 9 | 17 | 49 |
| 11 | 10 | 21 | 53 |
| 12 | 11 | 25 | 57 |
What this model assumes
Deterministic twelve-request example. One request arrives per day. Tasks are non-preemptive and take whole or quarter days; queues are first-ready, first-served. The WIP limit includes work waiting at handoffs. People are represented as independent stage slots, with no sharing, absences or rework. All times are working days.
SOURCES & FURTHER READING
The references behind the ideas.
The numbers in the experiment are illustrative. These references support the methods and distinctions discussed in the article.
- John D. C. Little, A proof for the queuing formula L = λW (1961) ↗
The original result behind the average inventory, throughput and time relationship.