/ ENGINEERING
How good is the measurement?
Before we argue about the model, we should check the instrument. A precise-looking number can still lead to the wrong call.
Try the model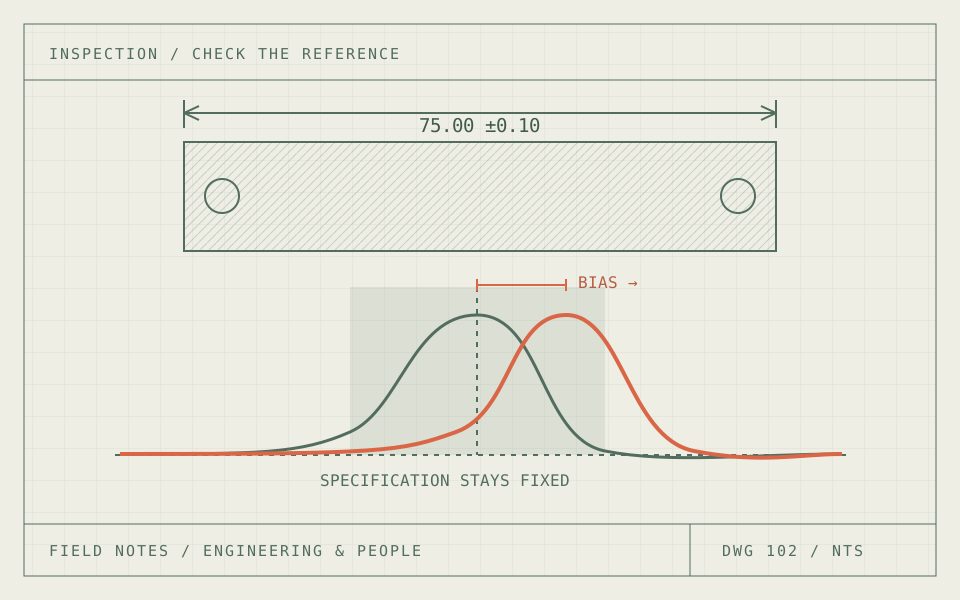
01 / CHECK THE REFERENCE
The part has not changed. The answer has.
A part is close to its upper size limit. One reading says it passes. The next says it fails. Before debating the machining process or retraining an inspection model, there is a simpler question: how much of that disagreement comes from the measurement?
In this example, a dimension has a nominal value of 75.00 mm and a specification of plus or minus 0.10 mm. The part, instrument and observations are synthetic. We know the part’s reference dimension because we created the example. A real inspection rarely offers that convenience.
The drawing separates three things that are often mixed together: the dimension we want to know, the reading an instrument produces and the rule used to accept the part. Keeping those separate makes it easier to see which change would actually improve the decision.
02 / CHECK THE REFERENCE
A repeatable wrong answer is still wrong.
Random variation makes readings spread out. Bias moves their average relative to a reference. A gauge can give tightly grouped readings and still sit consistently high. It can also have little average bias while individual readings vary too much for a useful acceptance decision.
The controls separate those effects. Increase the bias and the measurement distribution shifts sideways. Increase the reading noise and it spreads out. The specification limits stay fixed because they describe the part requirement, not the instrument’s behavior.
A measurement study should also ask what happens across operators, fixtures, instruments and days. Repeating the same setup ten times tells us about one kind of variation. It does not automatically describe what will happen when another person uses a different fixture on the next shift. NIST’s measurement guidance treats repeatability, reproducibility, stability and bias as distinct questions.
Reading = reference dimension + bias + random error
03 / CHECK THE REFERENCE
More readings help with one problem.
If reading errors are independent, have zero mean and come from a stable process with standard deviation σ, the standard deviation of their average is σ divided by the square root of the number of readings. Four readings halve that random component. Sixteen reduce it to a quarter. There is a diminishing return.
That calculation does not remove bias. Nor does it justify treating strongly correlated readings as independent information. If the fixture warms up between observations or the same alignment error affects every reading, taking more measurements may leave the important uncertainty untouched.
The shaded curve here is the assumed distribution of the average reading. The marker at its center is an expected value under the model, not a new observation from a physical gauge. Its interval shows plus or minus two standard errors under a normal-error assumption. That is roughly 95% coverage for this random component; it is not a complete uncertainty statement.
Standard deviation of the average = σ / √n
04 / CHECK THE REFERENCE
Calibration is a measurement too.
Compare the instrument with a suitable reference, estimate its bias and decide how to correct or account for that bias. The reference has uncertainty, the procedure has limits and the instrument can change afterward. A correction is useful, but it is not a certificate that every future reading is exact.
The calibration switch makes a deliberately generous assumption: it knows the simulated bias and removes it perfectly. That helps isolate the effect of an offset. A real uncertainty budget must carry the uncertainty of that correction, along with other relevant contributions such as resolution, temperature, alignment and reproducibility.
Now move the reference dimension close to a limit. Even a centered instrument can produce readings on both sides. An acceptance rule may need an uncertainty-aware margin or an additional check. Choosing that rule requires agreement about the consequences of accepting a bad part and rejecting a good one. A drawing tolerance alone does not settle that tradeoff.
05 / CHECK THE REFERENCE
The same problem turns up in the training data.
Suppose those readings become pass/fail labels for a machine-learning model. Near the limit, some labels now describe the behavior of the measurement system as much as the condition of the part. A model can learn that pattern quite faithfully. Better optimization will not tell it which labels came from a biased gauge.
I would investigate disagreement near the boundary, repeat a subset of measurements under controlled conditions and compare against a better-characterized reference where practical. Keep the raw readings and the conditions, rather than retaining only the final label. That makes it possible to revisit a decision without pretending the original observation was perfect.
The batch output below averages expected decisions over 301 evenly spaced reference dimensions from 74.85 to 75.15 mm. That artificial mix deliberately includes many borderline parts. Its error totals do not estimate a factory’s scrap rate. They show why improving the measurement can be a more useful next step than changing the model.
THE EXPERIMENT / CHANGE ONE THING
Move the instrument, not the tolerance.
Adjust bias, reading noise and the number of independent readings. Move the selected reference part across the specification boundary.
SYNTHETIC EXAMPLE / LIVE RESULTS
Across the artificial batch of 301 dimensions: 34.5 expected false accepts among 100 out-of-spec parts, and 44.9 expected false rejects among 201 in-spec parts. This boundary-heavy mix is not a forecast of production quality.
What this model assumes
Known synthetic reference dimensions; additive, normally distributed, independent errors with constant standard deviation. Averaging is applied separately to each part. Perfect bias correction is an illustrative upper bound. Expected batch errors are calculated analytically for 301 equally weighted dimensions, not sampled observations or a production forecast. Other uncertainty sources are excluded.
SOURCES & FURTHER READING
The references behind the ideas.
The numbers in the experiment are illustrative. These references support the methods and distinctions discussed in the article.
- NIST: Measurement process characterization ↗
A framework for studying calibration, repeatability, reproducibility, stability and uncertainty.
- NIST Technical Note 1297: Terminology ↗
Why measurement uncertainty needs more than a repeatability number.