/ RESEARCH NOTES
Which layers should get a say?
Attention Residuals revisits how a network combines its earlier work. Explore what changes when every layer no longer gets the same weight.
Try the model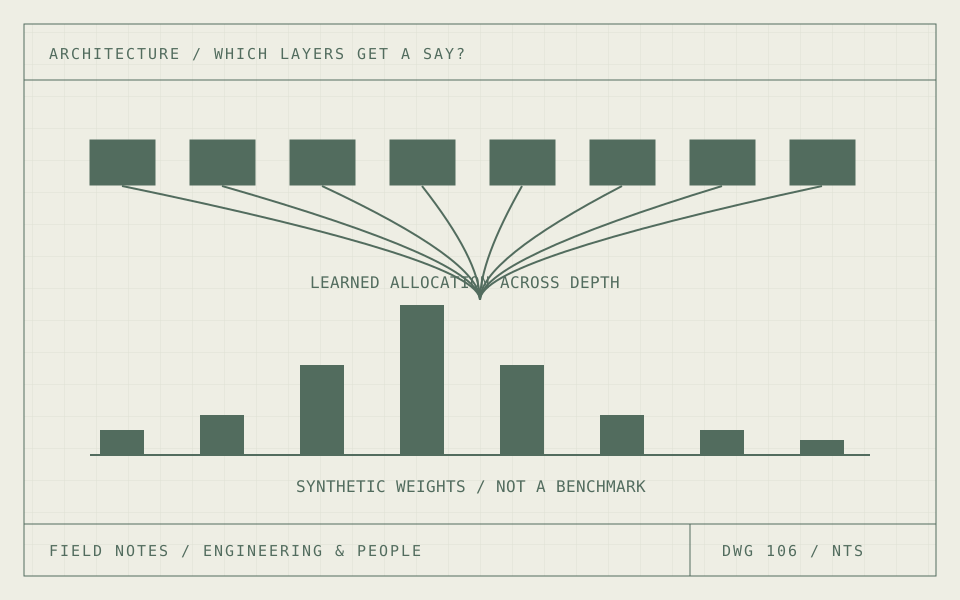
01 / READ THE METHOD
A deeper network has more work to carry forward.
Imagine a design review where every previous comment gets carried into the next meeting at the same volume. Some comments still matter. Others belong to decisions that have already been settled. More discussion does not automatically produce a clearer decision.
A neural network is not a meeting, but the analogy gives us a useful question: how should a later layer use representations produced earlier? Residual connections provide paths for information and gradients. Choosing how to combine those paths is an architectural decision with consequences for training.
The interesting part of this paper is where it looks for improvement. It revisits the connections between layers rather than adding another instruction, dataset or benchmark-specific trick. For anyone managing model development, it is a reminder to examine the structure that carries the work, not only the work being added.
02 / READ THE METHOD
Replace fixed accumulation with a learned mixture.
The Kimi team proposes Attention Residuals, or AttnRes: softmax attention over preceding layer outputs replaces fixed residual accumulation. Learned, input-dependent weights determine which earlier representations contribute. Block AttnRes groups representations to reduce the memory and communication burden of the full version.
The report evaluates scaling and integrates the method into a Kimi Linear model with 48 billion total and three billion active parameters, trained on 1.4 trillion tokens. It reports improved downstream results across its evaluated tasks. Those are the authors’ experiments, not measurements produced by this page.
Think of the mixture weights as a routing decision. They are not labels saying that one layer is universally good or bad. A different input can call for a different combination. A large weight also does not, by itself, establish a complete causal explanation of a prediction.
Illustrative mixture: αᵢ = softmax(similarityᵢ / temperature); output = Σᵢ αᵢ × valueᵢ
03 / READ THE METHOD
Make the routing visible.
The experiment has eight invented unit vectors, one for each source layer. Pick a query direction and adjust temperature. Similarity to that direction sets the scores; softmax turns them into weights that sum to one. The green bars show the resulting allocation, alongside an equal-weight reference.
Lower temperature concentrates the allocation. Higher temperature spreads it more evenly. The projection measures how far the mixed vector points along the selected query direction. It is a geometric quantity in this toy example, not model accuracy, loss reduction or a benchmark result.
This deliberately leaves out learned pseudo-queries, normalization details, real hidden states, blocks and distributed execution. The temperature control is a teaching device. Its purpose is to let you inspect normalized mixing, not reproduce the training recipe or prove that sharper attention is always better.
04 / READ THE METHOD
A better route still has a bill to pay.
Accessing earlier representations takes storage and movement. Before celebrating a lower loss, I would ask what happens to peak memory, communication, wall-clock training and inference at the operating batch sizes. A model that is cheaper in one accounting system can be expensive in another.
A useful comparison holds the training data, evaluation protocol and practical resource budget steady. Run several seeds where feasible, inspect learning curves and separate training stability from final quality. Then test the tasks that matter to your application instead of treating an aggregate score as a delivery guarantee.
For a small team, training a frontier model solely to try a connection change would be a poor first experiment. Begin with a tractable research baseline and the authors’ resources. Establish that the implementation behaves as intended before scaling it.
05 / READ THE METHOD
The practical lesson is about selective reuse.
Try moving the query from one source to another while keeping temperature fixed. Then keep the query fixed and change temperature. Those are different changes: one alters what is relevant, the other how strongly the routing favors it. That distinction is easier to see in the bars than in an equation alone.
I would describe this paper to a technical leadership team as a proposal for better information reuse. The investment decision depends on whether the measured benefit survives implementation cost, realistic workloads and independent evaluation. The diagram makes the mechanism approachable; the paper and code are where a reproduction should begin.
An architecture result earns its place in a product when someone can explain both its gain and its operating cost. That is the standard I would use here.
THE EXPERIMENT / CHANGE ONE THING
Choose which earlier representation matters.
Change the query direction and mixing temperature. Compare normalized attention with an equal-weight reference.
SYNTHETIC EXAMPLE / LIVE RESULTS
Projection is along the selected direction in a synthetic two-dimensional space. It is not model accuracy. All eight uniform weights are 12.5%.
Read the mixing weights
| Source | Similarity | Attention | Uniform |
|---|---|---|---|
| 1 | 0.000 | 7.9% | 12.5% |
| 2 | 0.707 | 21.7% | 12.5% |
| 3 | 1.000 | 33.0% | 12.5% |
| 4 | 0.707 | 21.7% | 12.5% |
| 5 | 0.000 | 7.9% | 12.5% |
| 6 | -0.707 | 2.9% | 12.5% |
| 7 | -1.000 | 1.9% | 12.5% |
| 8 | -0.707 | 2.9% | 12.5% |
What this model assumes
Eight synthetic two-dimensional unit vectors. Similarity and temperature are chosen for explanation. No learned query, real language model, block implementation, training or benchmark inference runs here. Projection is not predictive quality.
SOURCES & FURTHER READING
The references behind the ideas.
The numbers in the experiment are illustrative. These references support the methods and distinctions discussed in the article.
- Attention Residuals ↗
First posted 16 March 2026. Technical report. The primary source for the method and reported evidence.
- Authors’ implementation and supporting material ↗
Original project resources. The browser experiment is an independent teaching illustration, not this implementation.